Review of First 11 hours
Discussion and findings on success since Saturday 10/11/12
We had what appeared to be a very successful loading, with strong and compelling evidence provided by the change to a lower resistivity of the wire over the course of the loading cycle. There is the possibility that we may be able to load even more hydrogen into the wire in further experiments over a long period of time.
Additionally it has been found that during the course of the active experiment there was also a period of apparent loading as can be seen in this graph.
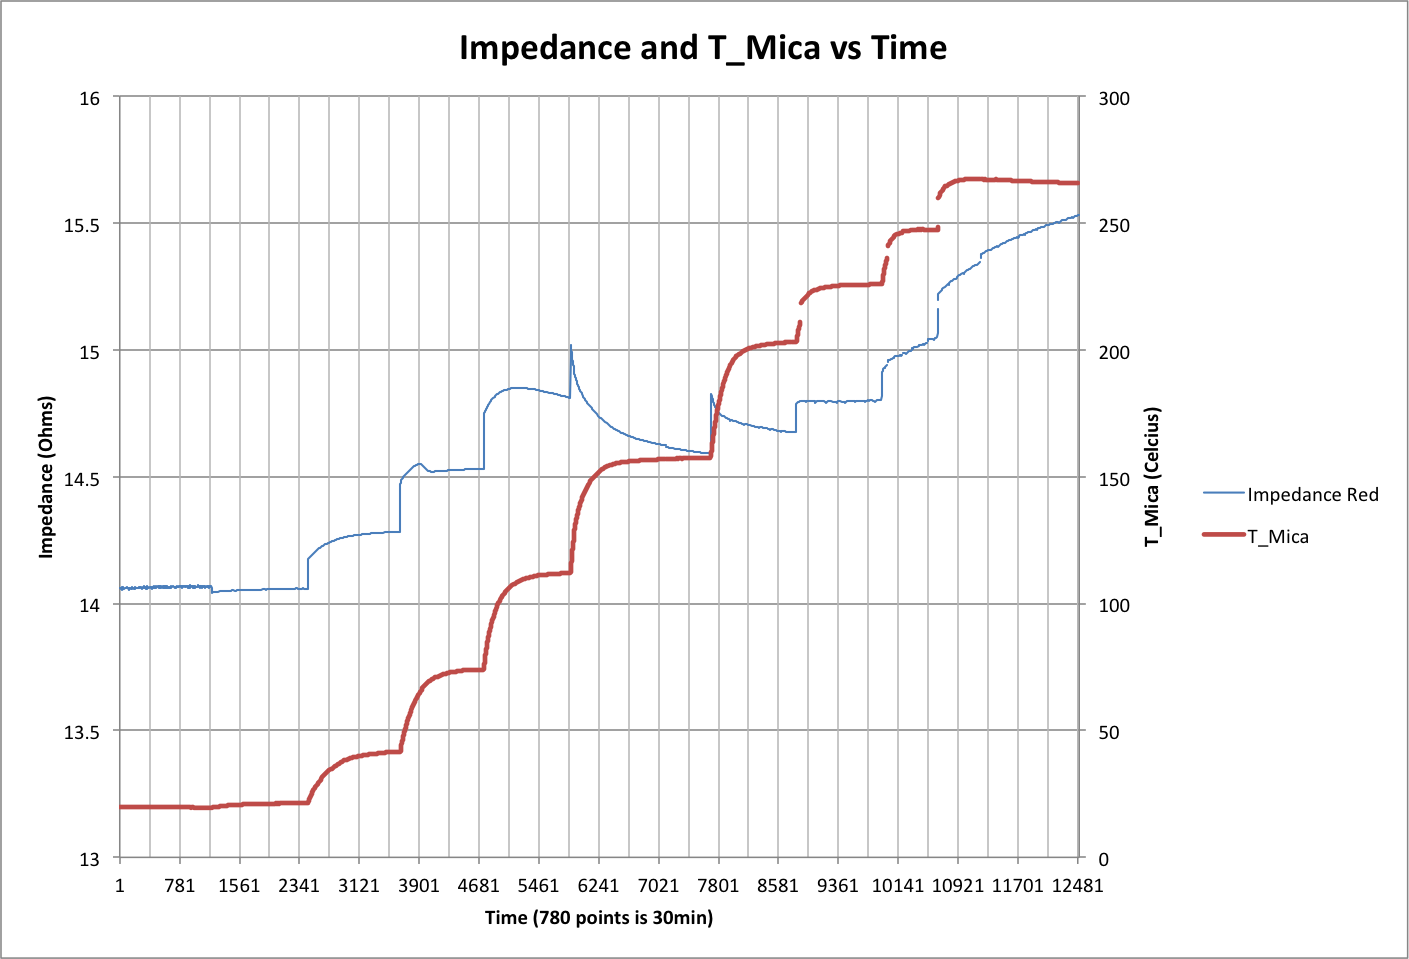
As you can see - initially the resistance increased, but at a certain point, there was some resistivity reduction even as more temperature was recorded in the T-Mica. This is extremely interesting. It may point to the loading/burning cycles suggested for commercial LENR configurations and why they need control and multiple reactors in a viable solution. Celani says that the bulk of the loading takes place in 10 - 20 minutes, this is what we found in our loading over the 10/11th November 2012 weekend. This would therefore require a reliable commercial design to have 3 active cells - 1 for cooling, one for loading and a third for “burning” and this may explain the configuration of 3 reactors in Rossi’s 1 MW reactor sub units or 9 in Defkalions configuration. When burning - a reactor working as part of a team could run at much higher temperatures producing dry steam even.
A single reactor would require times when it was at around 125-160 for loading and therefore would not be able to consistently output dry steam and therefore would be limited to producing low grade heat and may account for the specification of the home E-Cat and its need for kWs of heating 1 hour in six.
We also learned a lot about using the calibration data to determine the most useful calibration curves for excess power calculation.
Current test status
Our active run was done in a series of about 7 power steps to bring it up close to what we did during the calibration runs and allows us to compare how different wires are acting under different gas mixtures.
Based on our current assumptions, which we may need to review, we are measuring 2 to 3W of excess heat in the cell which has settled at about T_Mica= 265 C, however we do not consider this to be above the uncertainty/noise level, yet.
We will run the current experiment for a few days or until failure whichever is sooner - it will be interesting to follow:
- any potential events
- change in wire resistivity
- change in excess heat generation
Really interestingly, it might show us the time it takes for most of the H2 to be “burned” / lost based on the R/R0. This might give us more clues as to the duty cycle of these reactions. Maybe because the cell produces a modest excess output, it can run for days, if it produced 100s Watts then maybe the celani cell would have to go through a H2 loading cycle relatively quickly. Loading is separated from excess heat - but we believe we have shown that it can occur in the same cell.
It will also give us some time to explore the robustness of our data broadcasting that was severely stressed during the early part of the test with the number of connections and data downloads. This forced a change in server that whilst faster failed.
Temp in cell may not be high enough to trigger LENR.
Specifically, the local temperature of the wire may not be high enough to create the effect.
Our cell takes more power to heat it, because less of the IR is thermalized in the quartz glass than the borosilicate glass. T_mica shows the closest value of what the temperature of the wire is, and Pr. Celani explained that optimal temperature for the effect was between 250 C and 350 C.
Furthermore, increased current may create more near IR which is partially lost thought the quartz tube, see our previous analysis.
We don't want to risk any more current in the wire at this stage. We are already have twice the power that he had in his wire. It may damage it.
Reduce the pressure inside the cell to reduce thermal conductivity and decrease H2 recombination is our best option. At lower pressure we are able to increase the temperature inside the cell (T_mica) which might help triggering LENR effect without increasing the current inside the active wire. Because we did calibrations at 3 different temperatures, we are able to set what should be the pressure inside the cell for a certain amount of power injected.
If a set pressure of 2 bar at cold is not good enough to trigger the effect, we reduce the power input drastically and decrease the pressure at 0.5 bar. In this condition, the wire will tend to retain heat instead of dissipating it.
At some point we may decide to turn on both wires in order to achieve similar current and temperature in the Celani Wire to what he had in the demonstration.
Loading process may also need to cycle for best effect
When we started the loading, we thought we had to do it over 2 - 3 days, which we kind of did. We heated the wire up to the requisite temp in H2 and let it sit there. Celani says however, that the majority of the loading occurs in the first 10-20 mins as noted above - so why have it sit there for 3 days? Maybe we should be cycling it, ie, let it cool, bring it up to loading temp, repeat... n times.
In summary, after 11 hours since beginning to heat the Celani wire with current running through it, the experiment is just starting.
Data file to be added here ASAP:
Comments
If Rossi and Defkalion are virtually ready, as they claim, to sell commercial, stable and certified kilowatt level LENR reactors, what are you doing with single wires and arguable, low power levels? What's the point if the problem is already solved?
Your research makes the most sense if Rossi and Defkalion can not be believed. Thus, how they configure their reactors is sort of moot, don't you think?
As it happens, I don't believe Rossi and Defkalion and I think what you are doing is an excellent idea! Sorry to interrupt but I think it needed to be said.
think long - post short...
I also noticed in Celani's papers that he obtained the best results at wire temperatures as high as 900 Celsius.
I would suspect (from some experience) that heating these kind of wires to very high temperatures with high current is not too problematic - provided you take care not to induce too great a thermal shock - i.e. increase/decrea se current/temp slowly.
The thermal conductivity of Argon is 10 times less than H2. The addition of 10/90 H2/Ar (for example) might make sense if reducing the thermal conductivity of the gas admixture enables the necessary temperature to be reached to initiate the LENR.
It is likely that no excess heat is being generated at all, currently. It's true that this is still the beginning, though.
It's true that in other blog posts here I did propose data decimation in order to save server bandwidth, but decimation, if not extreme, retains most of the trend characteristics for each data series (especially if we're just cutting out what cannot be displayed due to lack of chart display resolution), does not smooth out the existing data.
Note: to clarify, since I write here often, I'm not a sponsor or a member of the MFMP team.
Of course, improving heat insulation would be the best option (and for the occasion, replacing the glass tube - since the inside would not be visible anymore anyway - with a steel tube might be a good idea for several reasons). That probably goes outside the scope of the current experimental phase (more or less exact replication of Celani's results with the same set-up).
If this is true, then during the USA morning with people around the reactor, apparent excess heat should decrease again to yesterday's initial values.
A bit of a disappointment, but even Celani as far as I know doesn't have a 100% success rate with new treated wires. The ones that work, though, should clearly (and reliably) do so.
I used to do this in my copper vapour laser research. (In my case to stop UV)
You could hold the glass outer tube in place using ‘PEEK’ ‘O’ rings placed around the quartz tube (these O rings are usable up to 550 Celsius). Cut one of the O rings to provide an air pressure equilibrium path.
machinedesign.com/.../...
I found this presentation by Celani to also be very helpful:
22passi.it/.../...
We saw something fascinating in the data that lends credence to some of the claims and configurations of players in this field. We are agnostic to the specific maker or inventor of a particular approach, we just want to see if we can help get the New Fire lit.
We are not setting out to show that a person is or is not telling the truth - we are just following the evidence and this evidence that we have seen come out of the first few hours of our first experiment is seemingly showing something really interesting.
Calculated excess power appears to be very slightly increasing too. However it's being significantly affected (at this level; I guess it wouldn't matter if excess power was larger) by irregularities in input power due to the power supply. A certain cyclical component in the output power chart trend definitely seems to be related to such power supply issues.
RSS feed for comments to this post